Right-Sizing Cache Retention with Decay Models
Using power law and exponential decay functions to model traffic decline and optimize cache retention periods
Finding the optimal cache capacity involves a multi-objective optimization problem: minimizing storage costs while maximizing performance benefits. There is no “silver bullet” or one-size-fits-all solution.
Storage costs and performance benefits scale differently. Storage losses are linear, performance gains have diminishing returns. You can spend unlimited money on storage, but can perfect performance earn enough to justify it?
It depends. We’re tackling website performance problems, and, unfortunately, serving a website to users in 1 ms isn’t likely to give you enough opportunity to outweigh the cost of petabyte-scale storage. This constraint comes from service providers (or Google): average TTFB over 200 ms means ranking penalties, but average TTFB under 200 ms will get you better rankings only up to a certain point because it’s one of many factors involved (remember, Google does not publicly disclose its ranking algorithm, and 200 ms is a number that appears in their documentation but can changed at any moment)
Fortunately, Google Search Console exposes average time to first byte in Crawl Stats (Settings → Crawl Stats) for any given day. While working on a cache solution, it comes down to:
avg_ttfb = hit_ratio × hit_ttfb + (1 - hit_ratio) × miss_ttfbTake 10 million pages at 500KB each and you’re looking at 5TB of content, or as AWS says, around $1,150 per month for RDS gp3 Multi-AZ.
Thing is, if you can serve cache hits in 100ms, you don’t need every single page cached, and you have 100ms budget left for misses. But it raises a question: “How do I spend this budget as efficiently as possible?”
To answer this question, we need to understand what TTFB budget means for caching. Average TTFB is based on requests and their response time. Cache HIT are fast and positively impact average TTFB. Cache MISSes are the opposite. Naturally, you might ask, “Which pages should I cache, then?” Based on this logic, the answer would be those that receive more requests than others. Here we come to our main assumption:
Pages requested recently have a higher probability of being requested again soon than pages that were requested a long time ago.
In my experience, this assumption works in 95% of cases. It’s not universally applicable, but there are some evidence confirming the correlation:
Ok, unpopular pages are less likely to be visited again soon. But how much less likely?
Decay Functions
Welcome to decay functions. In our case these functions describe the number of page views over time for any page that receives a lot of traction early in its lifecycle and then rapidly - but not linearly - declines.
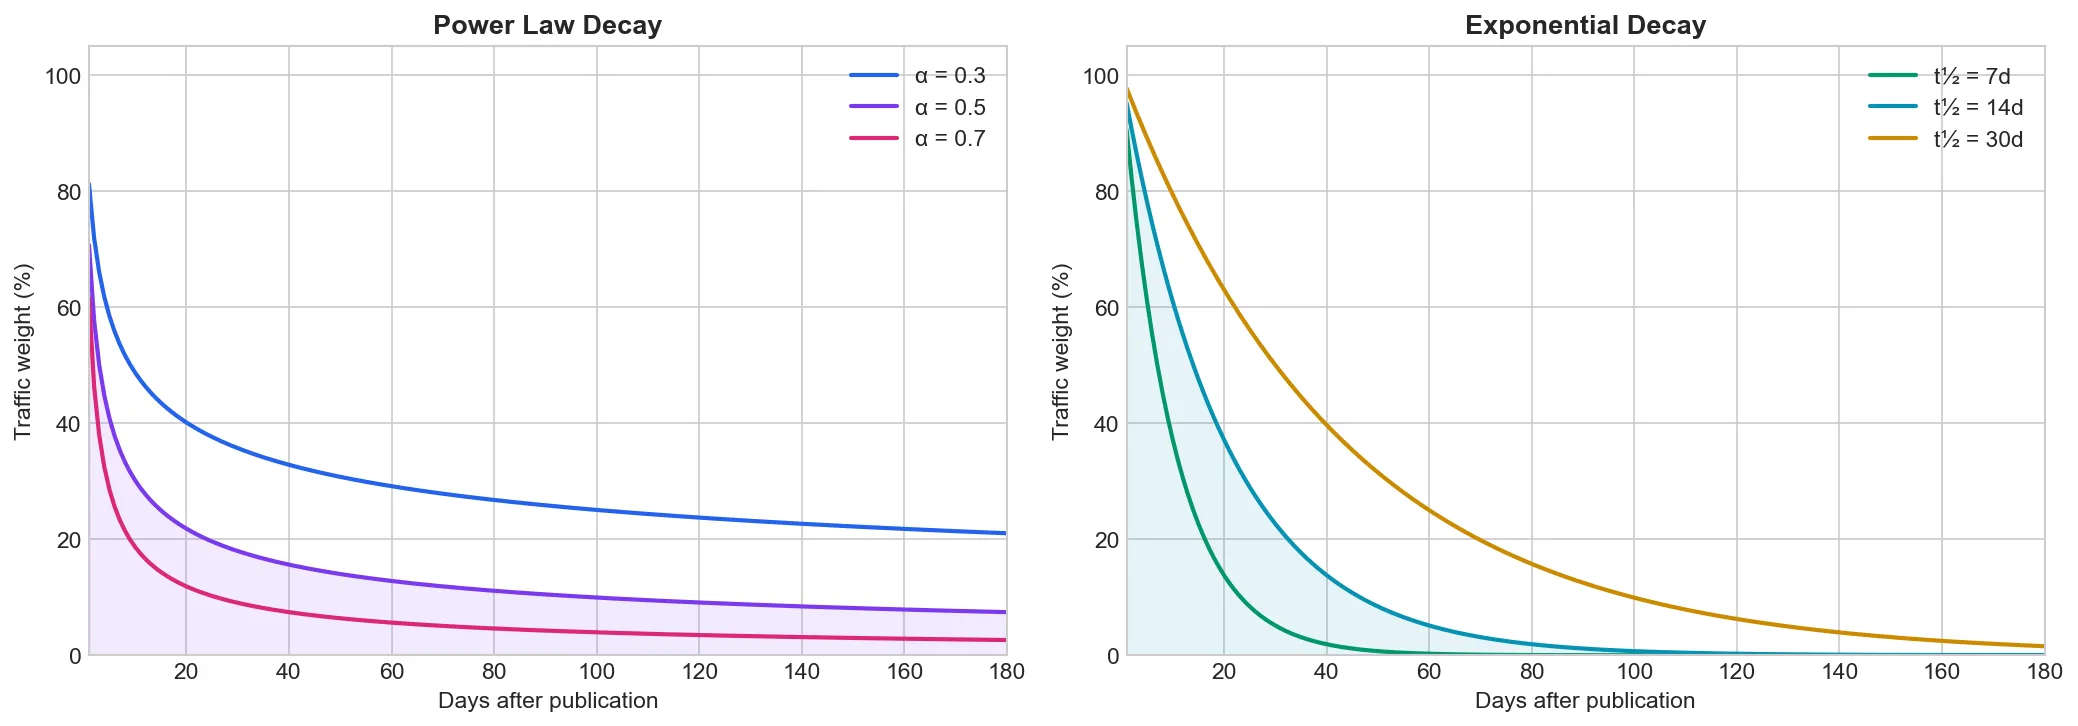
Power law (left) has a long tail - old pages keep receiving some traffic.
Exponential (right) drops sharply - after some time, traffic is effectively zero.
We can use these functions to model page lifecycle and predict page-view numbers. These models are probabilistic and won’t predict exact numbers. Despite that, they may fit the average case well and provide a solid basis for expectations.
Power Law
weight = 1 / (days_since_visit + 1) ^ alphaOn day 0 weight starts at 1.0. As days pass without a visit, weight drops but never reaches zero. alpha controls decay speed:
| Alpha | Behavior | Use Case |
|---|---|---|
| 0.3–0.5 | Slow decay | Evergreen content, wikis |
| 0.5–0.7 | Moderate decay | Mixed content, blogs |
| 0.7–1.0 | Fast decay | News sites, trending content |
Hit Ratio
The process is very simple. We use aggregated data on how many unique pages were visited one day ago, two days ago, and so on. Each day is assigned a weight based on a decay model to build the expected share of future page views.
We work with aggregate data: page counts grouped by days since last visit. Pull from access logs or cache metadata.
| Days Since Visit | Page Count |
|---|---|
| 0 | 2,000 |
| 1 | 2,500 |
| 7 | 4,000 |
| 30 | 6,000 |
| 90 | 10,000 |
| 180 | 5,500 |
| Total | 30,000 |
Apply decay weights (alpha=0.7). Multiply each bucket’s page count by its weight - this estimates that bucket’s share of future traffic:
| Days Since Visit | Page Count | Weight | Weighted |
|---|---|---|---|
| 0 | 2,000 | 1.00 | 2,000 |
| 1 | 2,500 | 0.62 | 1,550 |
| 7 | 4,000 | 0.23 | 920 |
| 30 | 6,000 | 0.09 | 540 |
| 90 | 10,000 | 0.04 | 400 |
| 180 | 5,500 | 0.02 | 110 |
| Total | 30,000 | 5,520 |
Recent pages dominate: 28% of pages (days 0–7) account for 81% of weighted traffic. This is the core insight - cache recent pages to capture most traffic.
Retention policy: cache pages visited within the last N days.
hit_ratio = cached_weighted / total_weightedWith 30-day retention, we cache the first four buckets:
- Cached: 14,500 pages (48%)
- Cached weighted: 5,010 (91%)
- Hit ratio: 5,010 / 5,520 = 91%
avg_ttfb = 0.91 × 100ms + 0.09 × 1000ms = 181ms48% of pages, 91% of weighted traffic, 181ms TTFB. That’s a 52% storage reduction while staying under 200ms.
Finding the threshold:
| Retention | Pages % | Hit Ratio | Avg TTFB |
|---|---|---|---|
| 7 days | 28% | 81% | 271ms |
| 30 days | 48% | 91% | 181ms ✓ |
| 90 days | 82% | 98% | 118ms |
The minimum retention that keeps TTFB under 200ms determines your cache size.
The decay model is an assumption. After deployment, compare predicted hit ratio against actual - if they diverge, adjust alpha.
Conclusion
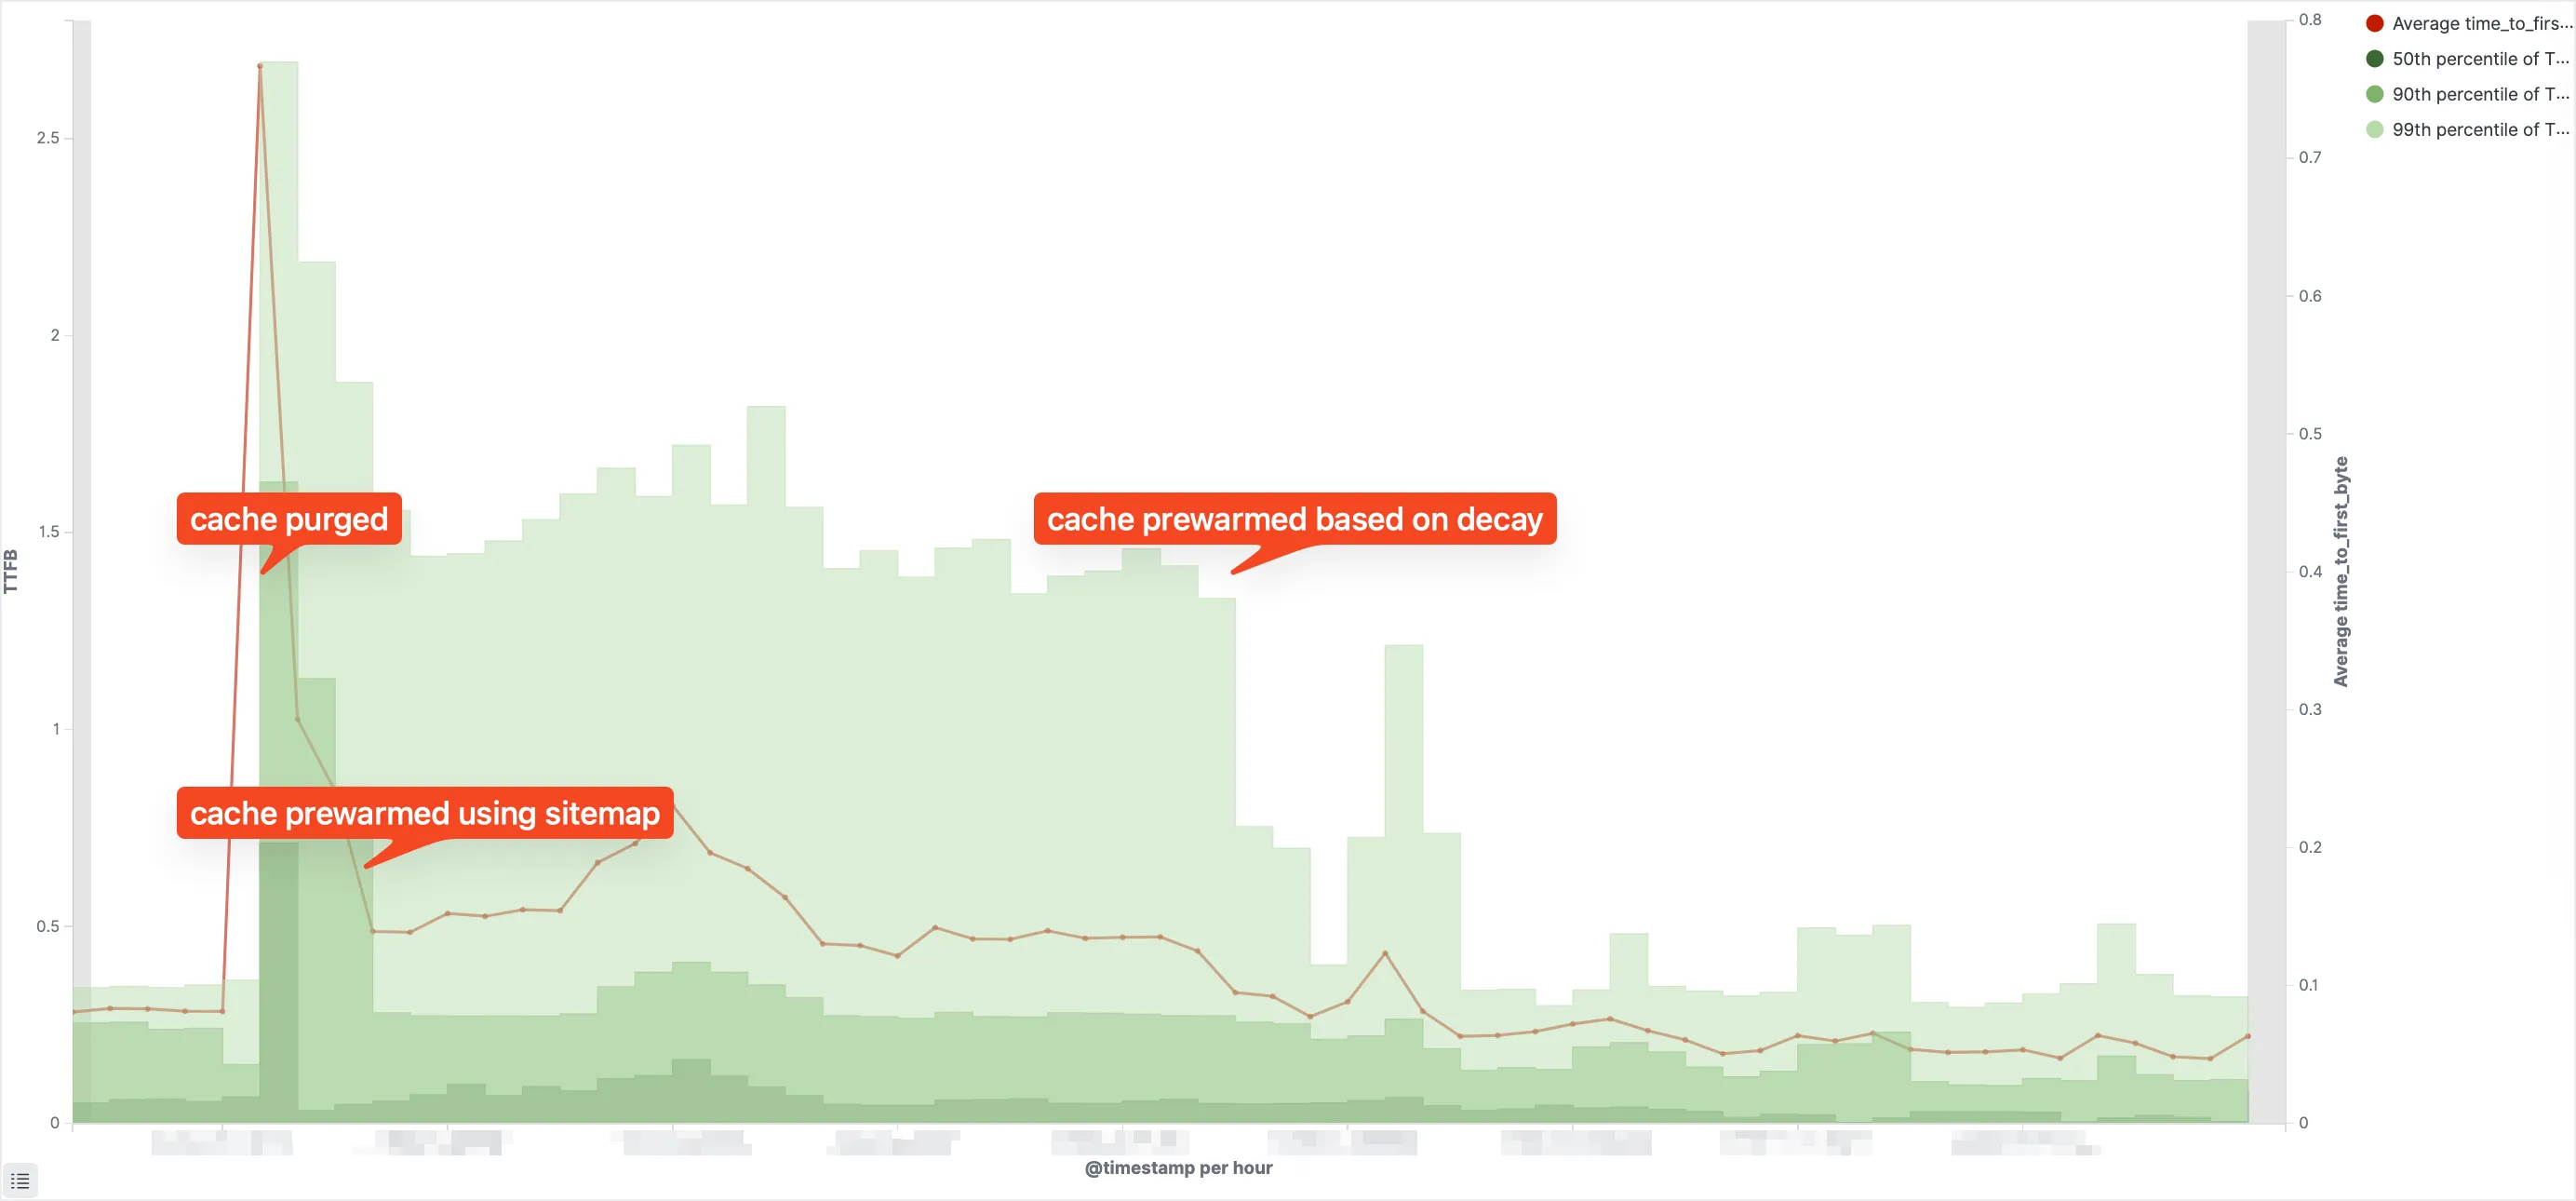
Real-world TTFB after cache purge: sitemap-based prewarming vs decay-based prewarming.
Sitemap prewarming recovers only default page variants - it misses A/B tests, personalized content, and other cache variations. Access logs capture what was actually requested, including all variants. Combined with decay weighting, this achieves lower and more stable TTFB.